Un proiect VAWT Offshore este cel propus de Gwind care demonstreaza avantajul centrului de greutate pozitionat la o distanta mica fata de nivelul marii.

Prototipul foloseste turbine eoliene verticale realizate de UGE.

Un proiect VAWT Offshore este cel propus de Gwind care demonstreaza avantajul centrului de greutate pozitionat la o distanta mica fata de nivelul marii.
Prototipul foloseste turbine eoliene verticale realizate de UGE.
In acest moment turbinele VAWT prezinta un interes deosebit pentru utilizarea offshore datorita a trei mari avantaje :

Proiectele lansate in Europa sunt : Nenuphar , Aerogenerator SpinFloat si DeepWind.
Prototipul turbinei DeepWind demonstreaza avantajul centrului de greutate amplasat mai jos decat la HAWT
Conceptul Aerogenerator arata posibilitatea construirii unei turbine VAWT gigant
Proiectul Nenuphar este cel mai avansat cu un buget alocat imens.

Un alt proiect VAWT de 6MW offshore : SpinFloat

Curios dar un Hrotor fara un profil aerodinamic poate genera putere. In simulare soliditatea este egala cu 1. Randamentul turbinei in simulare este de 0.12
https://www.youtube.com/watch?v=H6dPNKastO8#t=40
Privind superfial putem spune ca componenta lift a turbinelor Thies, Lenz2, Crotor este asigurat de acest profil plat .
cp(lenz2)=cp(savonius)+cp (flat) adica 0.3=0.18+0.12
Acest tip de rotor ma duce cu gandul la rotorul Miller
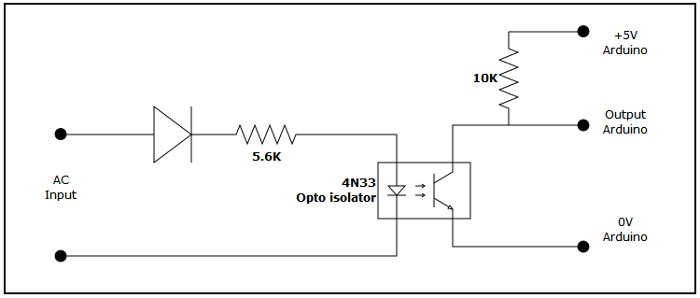
Turatie turbina : Una din metode este masurarea frecventei curentului alternativ produs de generator. In functie de numarul magnetilor de pe disc si a numarului de impulsuri contorizate in unitatea de timp se poate determina turatia turbinei.
|
1 2 3 4 5 6 7 8 9 10 11 12 13 14 15 16 17 18 19 |
for(int i=0;i<500;i++) { sample1+=analogRead(A1); //se citeste tensiunea sample2+=analogRead(A2); //se citeste curentul AC = digitalRead(2); // // Se contorizeaza trecerea prin "0" if ((AC == LOW) && (AC != lastAC )) { sample3++; } lastAC= digitalRead(2); delay(5); } sample1=sample1/500; // se mediaza tensiunea sample2=sample2/500; // se mediaza curentul turatie=sample3*60/2.5/8; // se calculeaza turatia in functie de numarul de magneti |
O turbina eoliana VAWT cu un start foarte bun la viteze mici ale vantului .

VAWT live. Pentru realizarea unui grafic de putere in timp real sunt necesare urmatoarele :
un fisier „putere.php” care extrage valorile din baza de date SQL
|
1 2 3 4 5 6 7 8 9 10 11 12 13 14 15 16 17 18 19 20 21 22 23 24 25 26 27 28 29 30 31 32 33 34 35 36 37 38 39 40 41 42 43 44 45 46 47 48 49 50 51 52 53 54 55 56 57 58 59 60 61 62 63 64 65 66 67 68 69 70 71 72 73 74 75 76 77 78 79 80 81 82 83 84 85 86 87 88 89 90 91 92 93 94 95 96 97 98 99 100 101 102 103 104 105 106 107 108 109 110 111 |
<?php function connect_db() { mysql_connect("Localhost", "user", "parola") or die(mysql_error()); mysql_select_db("nume baza de date") or die(mysql_error()); } function showUsageTable() { echo "<a href=index.php>Grafic in timp real</a><br>"; echo "<center>Putere generata turbina</center><br>"; connect_db(); $result = mysql_query("SELECT * FROM tempLog WHERE timeStamp >= CURRENT_TIMESTAMP - INTERVAL 1 HOUR ORDER BY timeStamp DESC") or die (mysql_error()); ?> <table border="1" align=center> <tr><td width=160>Data si timp</td><td width=120>Temperatura (C)</td><td width=120>Umiditate (%)</td><td width=120>Curent (A)</td><td width=120>Tensiune (V)</td><td width=120>Putere (W) </td></tr> <?php while ($row = mysql_fetch_assoc($result)) { echo "<tr>"; echo "<td>".$row['timeStamp']."</td>"; echo "<td>".$row['temperature']."</td>"; echo "<td>".$row['humidity']."</td>"; echo "<td>".$row['curent']."</td>"; echo "<td>".$row['tensiune']."</td>"; echo "<td>".$row['putere']."</td>"; echo "</tr>"; } ?> </table> <?php } function getRange($from, $to) { connect_db(); $sql="SELECT * FROM tempLog WHERE timeStamp BETWEEN '${from}' AND '${to}' ORDER BY timeStamp ASC"; $result = mysql_query($sql) or die (mysql_error()); $ar=array(); while ($row = mysql_fetch_assoc($result)) { $pwr=intval($row['putere']); if ($pwr != 0){ array_push($ar, array(strtotime($row['timeStamp'])*1000, $pwr)); } } return $ar; } function getRangeJsn($from, $to) { header("Content-type: text/json"); $ar = getRange($from, $to); echo json_encode($ar); } function getLast($minutes) { $tm = time(); $from = date('Y-m-d H:i:s', $tm - $minutes*60); $to = date('Y-m-d H:i:s', $tm); return getRangeJsn($from, $to); } function getNow() { header("Content-type: text/json"); connect_db(); $result = mysql_query("SELECT * FROM tempLog ORDER BY timeStamp DESC LIMIT 1") or die (mysql_error()); $row = mysql_fetch_assoc($result); if ($row){ $ret = array(strtotime($row['timeStamp'])*1000, intval($row['putere'])); echo json_encode($ret); } } function updateputere($val) { connect_db(); $result = "INSERT INTO tempLog (putere) VALUES (".$val.")"; $add_member = mysql_query($result); } foreach($_GET as $key => $val){ switch ($key){ case "last": getLast($val); return; case "now": getNow(); return; case "add": updateputere($val); return; break; } } showUsageTable(); ?> |
Un fisier „index.php” care seteaza perioada de afisare a valorilor (implicit 60 minute) , rata de refresh (implicit 5 secunde) si genereaza graficul puterii generate folosind Highcharts.
|
1 2 3 4 5 6 7 8 9 10 11 12 13 14 15 16 17 18 19 20 21 22 23 24 25 26 27 28 29 30 31 32 33 34 35 36 37 38 39 40 41 42 43 44 45 46 47 48 49 50 51 52 53 54 55 56 57 58 59 60 61 62 63 64 65 66 67 68 69 70 71 72 73 74 75 76 77 78 79 80 81 82 83 84 85 86 87 88 89 90 91 92 93 94 95 96 97 98 99 100 101 102 103 104 105 106 107 108 109 110 111 112 113 114 115 116 117 118 119 120 121 122 123 124 125 126 127 128 129 130 131 132 133 134 135 136 137 138 139 140 141 142 143 144 145 146 147 148 149 150 151 152 153 154 155 156 157 158 159 160 161 162 163 164 165 166 167 168 169 170 171 172 173 174 175 176 177 178 179 180 181 182 183 184 185 186 187 188 189 190 191 192 193 194 195 196 197 198 199 200 201 |
<!DOCTYPE HTML> <html> <head> <meta http-equiv="Content-Type" content="text/html; charset=utf-8"> <title>Monitorizare turbina eoliana verticala</title> <script type="text/javascript" src="http://ajax.googleapis.com/ajax/libs/jquery/1.7.1/jquery.min.js"></script> <script type="text/javascript"> $(function () { var updatePeriod=5; var timeWindow=60; //------------------------------------------------------------------ var xmlhttp; if (window.XMLHttpRequest) { // code for IE7+, Firefox, Chrome, Opera, Safari xmlhttp=new XMLHttpRequest(); }else{ // code for IE6, IE5 xmlhttp=new ActiveXObject("Microsoft.XMLHTTP"); } function formatUnits(watts) { var units=['W', 'KW', 'MW', 'GW']; var unit = 0; while (Math.floor(watts) > 1000){ unit++; watts /= 1000.0; } var str=""+watts+" "+units[unit]; return str; } var chart; var firstSampleTime; function requestData() { $.ajax({ url: 'putere.php?now', cache: false, success: function(point) { var series = chart.series[0]; // Start shifting (removing old samples) the graph to show only // samples for last 'timeWindow' minutes var shift = (point[0]-firstSampleTime)/1000.0 > timeWindow*60; // Add new point to the chart if (series.data.length > 1){ var str = "Putere generata: "+formatUnits(point[1]); document.getElementById("myDiv").innerHTML="<h2>"+str+"</h2>"; if (point[1] != 0){ chart.series[0].addPoint(point, true, shift); } } // Schedule another update setTimeout(requestData, updatePeriod*1000); }, error: function(result) { var str = "Sistem offline. Incercare reconectare..."; document.getElementById("myDiv").innerHTML="<h2>"+str+"</h2>"; setTimeout(requestData, updatePeriod*1000); } }); } function prefetchData() { document.getElementById("myDiv").innerHTML="<h2>Se transfera date...</h2>"; $.ajax({ url: 'power.php?last='+timeWindow, cache: false, success: function(points) { chart.series[0].setData(points, true); var str = "Putere generata: "+formatUnits(points[points.length-1][1]); document.getElementById("myDiv").innerHTML="<h2>"+str+"</h2>"; // Store timestamp of the first received sample firstSampleTime=points[0][0]; }, error: function(result) { var str = "ERROR: "+String(result); document.getElementById("myDiv").innerHTML="<h2>"+str+"</h2>"; setTimeout(prefetchData, updatePeriod*1000); } }); return; } function chartNow() { chart = new Highcharts.Chart({ chart: { renderTo: 'container', type: 'spline', marginRight: 10, events: { load: requestData } }, title: { text: 'Putere turbina (interval de '+timeWindow+' minute)' }, xAxis: { type: 'datetime', // Resolution on the x axis. tickPixelInterval: 100 }, yAxis: { title: { text: 'Putere (W)' }, plotLines: [{ value: 0, width: 1, color: '#808080' }] }, tooltip: { // This will appear when you hover above the graph in the chart formatter: function() { return 'Timp: '+Highcharts.dateFormat('%Y-%m-%d %H:%M:%S', this.x) +'<br>'+ 'Putere generata: '+Highcharts.numberFormat(this.y, 2)+' Watts'; } }, legend: { enabled: false }, exporting: { enabled: false }, series: [{ marker: { radius: 2 }, name: 'Putere (Watts)', }] }); } $(document).ready(function() { Highcharts.setOptions({ global: { useUTC: false } }); chartNow(); prefetchData(); }); }); </script> </head> <body> <script src="http://code.highcharts.com/highcharts.js"></script> <script src="http://code.highcharts.com/themes/gray.js"></script> <script src="http://code.highcharts.com/modules/exporting.js"></script> <table width=100%> <tr> <td> <div id="container" style="min-width: 400px; height: 400px; margin: 0 auto"></div> <div id="myDiv"><h2>Usage now: 0 Watts</h2></div> <a href="putere.php">Vezi datele</a><BR> </td> </tr> </table> </body> <head> </html> |
VAWT online . Pentru afisarea live a parametrilor furnizati de senzori prin intermediul Arduino si inregistrati intr-o baza de date SQL se foloseste formatul de date „JSON” si Google Gauge.

1.” data.php” pentru pentru interogarea bazei de date si trimitere a datelor in format „JSON”
|
1 2 3 4 5 6 7 8 9 10 11 12 13 14 15 |
<?php // Conectare la baza de date mysql_connect("Localhost", "user", "parola") or die(mysql_error()); mysql_select_db("nume baza de date") or die(mysql_error()); $result = mysql_query("SELECT * FROM tempLog ORDER BY timeStamp DESC LIMIT 1") or die (mysql_error()); $row = mysql_fetch_assoc($result); echo json_encode($row); exit; ?> |
2. „index.html” pentru afisare folosind Google Gauge:
|
1 2 3 4 5 6 7 8 9 10 11 12 13 14 15 16 17 18 19 20 21 22 23 24 25 26 27 28 29 30 31 32 33 34 35 36 37 38 39 40 41 42 43 44 45 46 47 48 49 50 51 52 53 54 55 56 57 58 59 60 61 62 63 64 65 66 67 68 69 70 71 72 73 74 75 76 77 78 79 80 81 82 83 84 85 86 87 88 89 90 91 92 93 94 95 96 97 98 99 100 101 102 103 104 105 106 107 108 109 110 111 112 113 114 115 116 117 118 119 120 121 122 123 124 125 126 127 128 129 130 131 132 133 134 135 136 137 138 139 140 141 142 143 144 145 146 147 148 |
<!DOCTYPE html PUBLIC "-//W3C//DTD XHTML 1.0 Strict//EN" "http://www.w3.org/TR/xhtml1/DTD/xhtml1-strict.dtd"> <html xmlns="http://www.w3.org/1999/xhtml"> <head> <meta http-equiv="content-type" content="text/html; charset=utf-8"/> <title> standard title page </title> <!-- google api don’t change --> <script type="text/javascript" src="http://www.google.com/jsapi"></script> <script src="//ajax.googleapis.com/ajax/libs/jquery/1.10.2/jquery.min.js"></script> <script type="text/javascript"> google.load('visualization', '1', {packages: ['gauge']}); google.setOnLoadCallback(drawVisualization); $(document).ready(function() { chart = new google.visualization.Gauge(document.getElementById('visualization')); chart2 = new google.visualization.Gauge(document.getElementById('visualization2')); chart3 = new google.visualization.Gauge(document.getElementById('visualization3')); chart4 = new google.visualization.Gauge(document.getElementById('visualization4')); chart5 = new google.visualization.Gauge(document.getElementById('visualization5')); // first graph (temperatura proc) data = google.visualization.arrayToDataTable([ ['Label', 'Value'], ['C', 0], ]); options = { width: 250, height: 250, max:100, min:0, animation:{duration: 500}, redFrom:70, redTo:100, yellowFrom:50, yellowTo:70, greenFrom:0, greenTo:50, minorTicks: 10, majorTicks: ["-20",,20,,40,,60,,80,,100] }; // second graph (CURENT) data2 = google.visualization.arrayToDataTable([ ['Label', 'Value'], ['A', 0], ]); options2 = { width: 250, height: 250, max:20, min:0, animation:{duration: 500}, redFrom:15, redTo:20, yellowFrom:10, yellowTo:15, greenFrom:0, greenTo:10, minorTicks: 10, majorTicks: ["0",,5,,,10,,,15,,20] }; // third graph (tensiune) data3 = google.visualization.arrayToDataTable([ ['Label', 'Value'], ['V', 0], ]); options3 = { width: 250, height: 250, max:16, min:0, animation:{duration: 500}, redFrom:0, redTo:10, yellowFrom:10, yellowTo:14, greenFrom:14, greenTo:16, minorTicks: 10, majorTicks: ["0",,4,,,8,,,12,,16] }; // third graph (putere) data4 = google.visualization.arrayToDataTable([ ['Label', 'Value'], ['W', 0], ]); options4 = { width: 250, height: 250, max:200, min:0, animation:{duration: 500}, redFrom:150, redTo:200, yellowFrom:100, yellowTo:150, greenFrom:0, greenTo:100, minorTicks: 10, majorTicks: ["0",,50,,,100,,,150,,200] }; // first graph (UMIDITATE) data5 = google.visualization.arrayToDataTable([ ['Label', 'Value'], ['%', 0], ]); options5 = { width: 250, height: 250, max:100, min:0, animation:{duration: 500}, redFrom:70, redTo:100, yellowFrom:50, yellowTo:70, greenFrom:0, greenTo:50, minorTicks: 10, majorTicks: ["0",,20,,40,,60,,80,,100] }; }); // function to update data automatically function drawVisualization() { chart.draw(data,options); chart2.draw(data2,options2); chart3.draw(data3,options3); chart4.draw(data4,options4); chart5.draw(data5,options5); } function test(ajaxdata) { var curent=ajaxdata.curent; var temperature=ajaxdata.temperature; var tensiune=ajaxdata.tensiune; var putere=ajaxdata.putere; var humidity=ajaxdata.humidity; console.log(ajaxdata); data.setValue(0,1,temperature); data2.setValue(0,1,curent); data3.setValue(0,1,tensiune); data4.setValue(0,1,putere); data5.setValue(0,1,humidity); chart.draw(data,options); chart2.draw(data2,options2); chart3.draw(data3,options3); chart4.draw(data4,options4); chart5.draw(data5,options5); } function status_update() { var jqxhr = $.getJSON('data.php?' + 'random=' + Math.random(), function() { }) .fail(function() { }) .done(function(ajaxdata) { test(ajaxdata); }); } var refreshId = setInterval('status_update()', 1000); $.ajaxSetup({ cache: false }); </script> </head> <!-- html standard for view a graph --> <body style="font-family: Arial;border: 0 none;"> <div id="visualization2" style="float: left; width: 250px; height: 250px;"></div> <div id="visualization3" style="float: left; width: 250px; height: 250px;"></div> <div id="visualization4" style="float: left; width: 250px; height: 250px;"></div> <div id="visualization" style="float: left; width: 250px; height: 250px;"></div> <div id="visualization5" style="float: left; width: 250px; height: 250px;"></div> </body> </html> |
VAWT ARDUINO
Pentru a inregistra parametrii de functionare a unei turbine eoliene intr-o baza de date SQL se poate folosi solutia compusa din :
1. configuratia hardware din :http://vawt.ro/vawt-arduino/
2. codul pentru Arduino care transfera prin metoda POST date catre un fisier php aflat pe server
|
1 2 3 4 5 6 7 8 9 10 11 12 13 14 15 16 17 18 19 20 21 22 23 24 25 26 27 28 29 30 31 32 33 34 35 36 37 38 39 40 41 42 43 44 45 46 47 48 49 50 51 52 53 54 55 56 57 58 59 60 61 62 63 64 65 66 67 68 69 70 71 72 73 74 75 76 77 78 79 80 81 82 83 84 85 86 87 |
#include <dht.h> #include <Ethernet.h> #include <SPI.h> #include <Wire.h> byte mac[] = { 0x00, 0xAA, 0xBB, 0xCC, 0xDE, 0x01 }; // MAC ADDRESS EthernetClient client; dht DHT; ///////////////////////////////////////////////////////////////////////////////////////////////////////////////////////////////////////////////// /// se initializeaza variabilele float val11=0; float val2=0; float i1 = 0; float i = 0; float curent=0; float tensiune=0; int t = 0; int h = 0; float sample1=0; float sample2=0; float p=0; String data; void setup() { Serial.begin(9600); if (Ethernet.begin(mac) == 0) { Serial.println("Failed to configure Ethernet using DHCP"); } data = ""; } void loop(){ DHT.read11(A0); // se citeste senzorul de temperatura si umiditate h = (int) DHT.humidity; t = (int) DHT.temperature; ///////////////////////////////////////////////////////////////////////////////////////////////////////////////////////////////////////////////// /// se stabileste numarul de valori care se mediaza si timpul dintre doua masuratori for(int i=0;i<500;i++) { sample1+=analogRead(A1); //se citeste sensorul de tensiune sample2+=analogRead(A2); //se citeste senzorul de curent delay(5); } sample1=sample1/500; sample2=sample2/500; //////////////////////////////////////////////////////////////////////////////////////////////////////////////////////////////////////////////// ///se calculeaza valorile float temp; val11=sample1; temp=val11/4.092; val2=(temp/10); i1 = sample2; i = ((.0049 * i1) - 2.5)/.066; p=i*val2; ////////////////////////////////////////////////////////////////////////////////////////////////////////////////////////////////////////////////// ///se transmit date catre server data = "temp1=" + String(t) + "&hum1=" + String(h)+ "&curent1=" + String(i)+"&tensiune1=" + String(val2)+"&putere1=" + String(p); if (client.connect("www.vawt.local",80)) { // adresa server client.println("POST /add.php HTTP/1.1"); client.println("Host: vawt.local"); // adresa server client.println("Content-Type: application/x-www-form-urlencoded"); client.print("Content-Length: "); client.println(data.length()); client.println(); client.print(data); Serial.print(data); } if (client.connected()) { client.stop(); // deconectare } delay(100); // intarziere pana la urmatorul ciclu de masuratori } |
3. un fisier „add.php” care primestele datele de la ARDUINO se conecteaza la baza de date si inregistreaza valorile in aceasta.
|
1 2 3 4 5 6 7 8 9 10 11 12 13 14 15 16 17 18 19 20 21 22 23 24 25 |
<?php // se conecteaza la baza de date mysql_connect("Localhost", "user", "parola") or die(mysql_error()); mysql_select_db("nume baza de date") or die(mysql_error()); $temp1=$_POST["temp1"]; $hum1=$_POST["hum1"]; $curent1=$_POST["curent1"]; $tensiune1=$_POST["tensiune1"]; $putere1=$_POST["putere1"]; $query = "INSERT INTO `tempLog` (`temperature`, `humidity`, `curent`, `tensiune`, `putere`) VALUES ('".$temp1."','".$hum1."','".$curent1."','".$tensiune1."','".$putere1."')"; mysql_query($query); mysql_close; header("Location: index.php"); ?> |
|
1 2 3 4 5 6 7 |
CREATE TABLE tempLog ( timeStamp TIMESTAMP NOT NULL PRIMARY KEY, temperature int(11) NOT NULL, humidity int(11) NOT NULL, curent decimal(5,2) NOT NULL, tensiune decimal(5,2) NOT NULL, putere decimal(5,2) NOT NULL); |

5. Un „web hosting” pentru baza de date SQL si fisiere.
Eu folosesc Hostico

