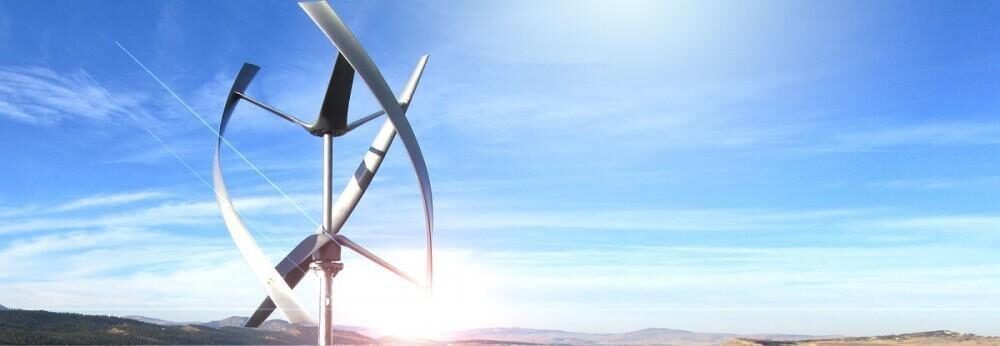
VAWT online . Pentru afisarea live a parametrilor furnizati de senzori prin intermediul Arduino si inregistrati intr-o baza de date SQL se foloseste formatul de date „JSON” si Google Gauge.

VAWT online codul necesar :
1.” data.php” pentru pentru interogarea bazei de date si trimitere a datelor in format „JSON”
|
1 2 3 4 5 6 7 8 9 10 11 12 13 14 15 |
<?php // Conectare la baza de date mysql_connect("Localhost", "user", "parola") or die(mysql_error()); mysql_select_db("nume baza de date") or die(mysql_error()); $result = mysql_query("SELECT * FROM tempLog ORDER BY timeStamp DESC LIMIT 1") or die (mysql_error()); $row = mysql_fetch_assoc($result); echo json_encode($row); exit; ?> |
2. „index.html” pentru afisare folosind Google Gauge:
|
1 2 3 4 5 6 7 8 9 10 11 12 13 14 15 16 17 18 19 20 21 22 23 24 25 26 27 28 29 30 31 32 33 34 35 36 37 38 39 40 41 42 43 44 45 46 47 48 49 50 51 52 53 54 55 56 57 58 59 60 61 62 63 64 65 66 67 68 69 70 71 72 73 74 75 76 77 78 79 80 81 82 83 84 85 86 87 88 89 90 91 92 93 94 95 96 97 98 99 100 101 102 103 104 105 106 107 108 109 110 111 112 113 114 115 116 117 118 119 120 121 122 123 124 125 126 127 128 129 130 131 132 133 134 135 136 137 138 139 140 141 142 143 144 145 146 147 148 |
<!DOCTYPE html PUBLIC "-//W3C//DTD XHTML 1.0 Strict//EN" "http://www.w3.org/TR/xhtml1/DTD/xhtml1-strict.dtd"> <html xmlns="http://www.w3.org/1999/xhtml"> <head> <meta http-equiv="content-type" content="text/html; charset=utf-8"/> <title> standard title page </title> <!-- google api don’t change --> <script type="text/javascript" src="http://www.google.com/jsapi"></script> <script src="//ajax.googleapis.com/ajax/libs/jquery/1.10.2/jquery.min.js"></script> <script type="text/javascript"> google.load('visualization', '1', {packages: ['gauge']}); google.setOnLoadCallback(drawVisualization); $(document).ready(function() { chart = new google.visualization.Gauge(document.getElementById('visualization')); chart2 = new google.visualization.Gauge(document.getElementById('visualization2')); chart3 = new google.visualization.Gauge(document.getElementById('visualization3')); chart4 = new google.visualization.Gauge(document.getElementById('visualization4')); chart5 = new google.visualization.Gauge(document.getElementById('visualization5')); // first graph (temperatura proc) data = google.visualization.arrayToDataTable([ ['Label', 'Value'], ['C', 0], ]); options = { width: 250, height: 250, max:100, min:0, animation:{duration: 500}, redFrom:70, redTo:100, yellowFrom:50, yellowTo:70, greenFrom:0, greenTo:50, minorTicks: 10, majorTicks: ["-20",,20,,40,,60,,80,,100] }; // second graph (CURENT) data2 = google.visualization.arrayToDataTable([ ['Label', 'Value'], ['A', 0], ]); options2 = { width: 250, height: 250, max:20, min:0, animation:{duration: 500}, redFrom:15, redTo:20, yellowFrom:10, yellowTo:15, greenFrom:0, greenTo:10, minorTicks: 10, majorTicks: ["0",,5,,,10,,,15,,20] }; // third graph (tensiune) data3 = google.visualization.arrayToDataTable([ ['Label', 'Value'], ['V', 0], ]); options3 = { width: 250, height: 250, max:16, min:0, animation:{duration: 500}, redFrom:0, redTo:10, yellowFrom:10, yellowTo:14, greenFrom:14, greenTo:16, minorTicks: 10, majorTicks: ["0",,4,,,8,,,12,,16] }; // third graph (putere) data4 = google.visualization.arrayToDataTable([ ['Label', 'Value'], ['W', 0], ]); options4 = { width: 250, height: 250, max:200, min:0, animation:{duration: 500}, redFrom:150, redTo:200, yellowFrom:100, yellowTo:150, greenFrom:0, greenTo:100, minorTicks: 10, majorTicks: ["0",,50,,,100,,,150,,200] }; // first graph (UMIDITATE) data5 = google.visualization.arrayToDataTable([ ['Label', 'Value'], ['%', 0], ]); options5 = { width: 250, height: 250, max:100, min:0, animation:{duration: 500}, redFrom:70, redTo:100, yellowFrom:50, yellowTo:70, greenFrom:0, greenTo:50, minorTicks: 10, majorTicks: ["0",,20,,40,,60,,80,,100] }; }); // function to update data automatically function drawVisualization() { chart.draw(data,options); chart2.draw(data2,options2); chart3.draw(data3,options3); chart4.draw(data4,options4); chart5.draw(data5,options5); } function test(ajaxdata) { var curent=ajaxdata.curent; var temperature=ajaxdata.temperature; var tensiune=ajaxdata.tensiune; var putere=ajaxdata.putere; var humidity=ajaxdata.humidity; console.log(ajaxdata); data.setValue(0,1,temperature); data2.setValue(0,1,curent); data3.setValue(0,1,tensiune); data4.setValue(0,1,putere); data5.setValue(0,1,humidity); chart.draw(data,options); chart2.draw(data2,options2); chart3.draw(data3,options3); chart4.draw(data4,options4); chart5.draw(data5,options5); } function status_update() { var jqxhr = $.getJSON('data.php?' + 'random=' + Math.random(), function() { }) .fail(function() { }) .done(function(ajaxdata) { test(ajaxdata); }); } var refreshId = setInterval('status_update()', 1000); $.ajaxSetup({ cache: false }); </script> </head> <!-- html standard for view a graph --> <body style="font-family: Arial;border: 0 none;"> <div id="visualization2" style="float: left; width: 250px; height: 250px;"></div> <div id="visualization3" style="float: left; width: 250px; height: 250px;"></div> <div id="visualization4" style="float: left; width: 250px; height: 250px;"></div> <div id="visualization" style="float: left; width: 250px; height: 250px;"></div> <div id="visualization5" style="float: left; width: 250px; height: 250px;"></div> </body> </html> |
